
A 13-week cash flow forecasting model is an essential financial management tool that provides businesses with direct visibility into short-term cash flow and liquidity. By tracking cash coming in and going out on a weekly basis, finance teams can spot potential shortfalls long before they occur. This rolling cash flow projection gives executive leadership the clarity needed to make confident operational decisions, protect working capital, and maintain strong vendor relationships. Implementing a structured short-term cash flow model ensures that your organization stays financially agile and prepared for unexpected market changes.
Understanding the 13-Week Cash Flow Forecasting Model
To truly master cash flow visibility, leadership must understand how a 13-week cash flow forecast works under the hood. Unlike traditional financial statements that rely on accrual accounting, this model uses the direct method of cash flow forecasting. It tracks the exact cash moving into and out of your bank accounts week by week, regardless of when invoices are dated or contracts are signed.
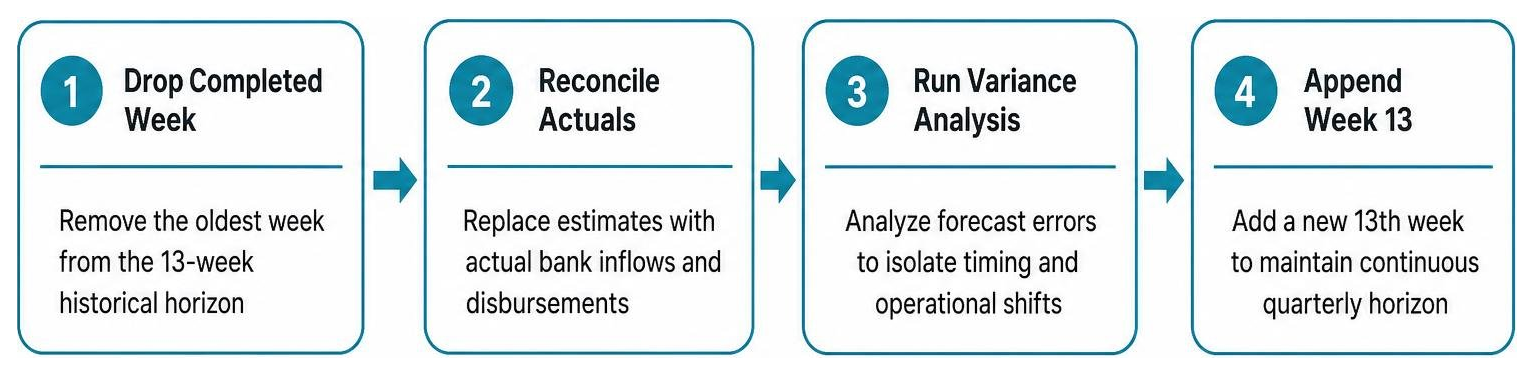
Because 13 weeks aligns perfectly with a single 91-day fiscal quarter, this model fits naturally into standard corporate reporting rhythms. It serves as a rolling window where each completed week drops off, actual cash numbers fill the void, and a new 13th week is added at the end. This constant refresh ensures leadership operates on live data rather than stale estimates and avoids cash flow problems.
Core Components of a 13-Week Cash Flow Forecast
Every functional cash model relies on a few fundamental line items to produce an accurate weekly picture. The starting foundation is your opening cash balance, which represents the verified, liquid cash sitting in your bank accounts at the beginning of the week. Uncollected checks or unbanked deposits should never be counted as liquid baseline cash.
Next are your cash receipts, which record expected cash inflows driven primarily by accounts receivable collections. It is critical to map these receipts according to when cash actually hits your account, taking into account historic customer payment delays. Cash inflows also include recurring subscription payments, asset sales, capital contributions, tax refunds, or line of credit drawdowns.
Finally, the model subtracts all cash disbursements, covering accounts payable, payroll, rent, debt service, tax deposits, and capital expenditures. Deducting total outflows from total inflows gives you the net cash flow projection for the week. Adding that net number to your starting balance yields your closing cash position, which then becomes the opening balance for the following week.
Why the 13-Week Horizon Is the Liquidity Sweet Spot
In cash management, the 13-week horizon represents the ideal balance between operational precision and strategic runway. Shorter projections, such as a 2-week or 4-week outlook, provide high accuracy but offer very little lead time to fix cash crunches. Conversely, 6-month or 12-month projections provide general direction but lack the granular detail required for daily payment choices.
The 91-day timeline provides an operational runway that accounts for typical business cash conversion cycles. Because average B2B payment terms range between 30 and 60 days, a 13-week cash flow projection captures the full cycle from invoice issuance to cash collection. It also encompasses fixed monthly obligations like rent and debt service, alongside quarterly tax payments.
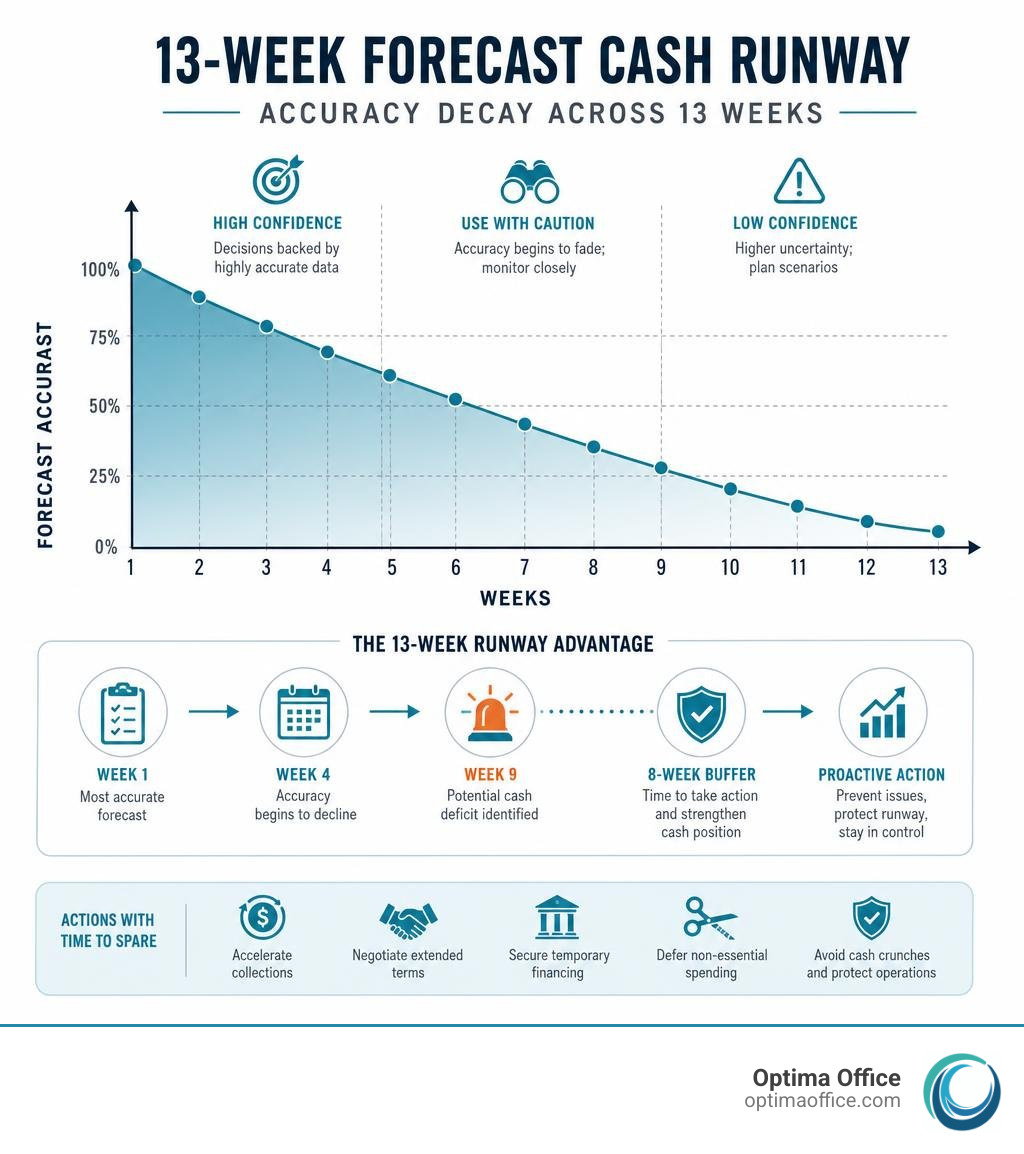
This window gives management an effective 8-week decision buffer. If your model identifies a cash deficit occurring in week nine, you have eight full weeks to take preventative action. That lead time allows you to accelerate collections, negotiate extended terms with suppliers, secure temporary financing, or defer non-essential purchases before a crisis hits.
Who Uses Short-Term Cash Flow Visibility and Primary Use Cases
Short-term cash flow visibility is essential for companies navigating operational growth, seasonal shifts, or financial distress. While large enterprises rely on direct forecasting for treasury operations, small and mid-sized businesses use it to prevent cash crunches. Having an accurate cash picture ensures leadership can make payroll, maintain vendor relationships, and keep operational control.
Private equity firms frequently require portfolio companies to maintain a 13-week cash flow forecast to monitor working capital and enforce debt compliance. Similarly, bank lenders often request weekly cash views before granting credit line increases or approving term loans. Having clear cash records builds immediate trust with financial partners.
Navigating Restructuring and Covenant Compliance
During turnaround scenarios or formal Chapter 11 bankruptcy proceedings, a 13-week cash flow projection becomes a mandatory legal requirement. Courts, turnaround consultants, and creditor committees demand this specific format to verify short-term viability and confirm that the business can support its ongoing operations. Credibility in court often hinges on the overall accuracy of these cash flow projections.

This model is also central to managing bank covenants, such as debt service coverage ratios or minimum liquidity metrics. Distressed or highly leveraged companies use it to calculate borrowing base revolvers against accounts receivable and inventory levels. By spotting covenant risks early, financial teams can negotiate waivers or adjust spending before default notices occur.
Strategic Cash Management in High-Growth and Volatile Markets
Even profitable, fast-growing companies can face sudden liquidity issues if growth outpaces cash generation. Expanding inventory, hiring new staff, and filling larger customer orders require upfront cash long before customer payments arrive. Direct cash flow forecasting helps rapidly scaling businesses manage working capital without running out of operational cash.
Market disruptions, inflationary pressures, and supply chain delays make cash flow visibility even more important. For instance, retailers navigating shifting consumer demand rely on weekly projections to adjust purchase orders and protect cash margins. Identifying tight cash periods early prevents emergency debt, inventory shortages, and damaged supplier relationships.
How to Build and Maintain a Dynamic Cash Flow Model
Building a reliable 13-week cash flow forecast requires clean baseline data, structured processes, and clear accountability across departments. Models constructed on weak assumptions or outdated ledger records create false confidence and increase financial risk. The main goal is to establish an integrated workflow that turns operational data into reliable cash flow projections.
The first step in setting up the model is defining its scope. Financial leadership must map out every legal entity, operational division, and underlying bank account included in the forecast. Multi-entity businesses must handle intercompany transfers carefully to avoid double-counting receipts or artificially inflating liquidity positions.
Step-by-Step Process to Build a 13-Week Cash flow Projection
Constructing an actionable short-term cash flow model requires a step-by-step approach that grounds every projection in verifiable transaction data. Finance teams must establish systematic procedures to aggregate numbers from various operational departments. Following a structured methodology helps ensure no critical revenue streams or expense obligations are overlooked during the planning process.
- Establish your true opening cash balance. Gather real-time ending balances across all operating, payroll, and reserve bank accounts, excluding restricted cash reserves.
- Extract and refine accounts receivable data. Export current AR aging reports from your accounting system, categorizing expected receipts by actual payment dates rather than invoice due dates.
- Schedule vendor payables and operating expenses. Pull AP aging schedules and cross-reference them with vendor payment terms, prioritizing essential operating expenses.
- Model payroll, wage withholdings, and employee benefits. Map out gross payroll, employer tax deposits, and benefit contributions based on exact pay dates.
- Layer in non-routine inflows, CAPEX, and debt service payments. Insert scheduled principal and interest payments, facility leases, planned capital expenditures, and non-operational receipts.
- Calculate net weekly cash flow and test minimum balances. Deduct total disbursements from cash receipts, append the ending cash balance, and check it against your internal cash safety threshold.
Maintenance Cadence and the Power of Weekly Variance Analysis
A 13-week cash flow model is only useful if it is regularly maintained and updated. Finance teams should establish a strict weekly cadence, updating the forecast every Monday morning or Friday afternoon. This maintenance cycle involves dropping the completed week, inserting actual bank results, and appending a new 13th week to maintain a continuous quarter-long outlook.

Variance analysis is the core feedback loop of direct cash flow forecasting. Each week, the finance team compares projected inflows and outflows against actual bank transactions. Identifying why variances occurred—whether a customer paid late or an operational expense ran high—helps refine future assumptions and improves accuracy over time.
Irregularly updated cash flow models often do more harm than good, as they create false confidence based on outdated numbers. Consistently reviewing variances helps eliminate estimation errors and prevents surprises. Over time, this disciplined process transforms short-term cash flow management into a predictable, repeatable routine.
Maximizing Accuracy, Overcoming Pitfalls, and Leveraging Advisory Leadership
Maintaining high cash flow forecast accuracy requires understanding how precision shifts over the 13-week horizon. Weeks one through four offer high operational accuracy because inflows and outflows are tied to existing invoices and scheduled obligations. From week five onward, projections become more directional, serving as a strategic guide for broader working capital decisions.

To maximize your 13-week cash flow model performance, finance teams must continuously refine their modeling logic. Understanding payment behaviors, seasonality, and vendor relationships helps bridge the gap between near-term precision and broader directional trends. Regularly updating payment history assumptions ensures the forecast reflects true operational reality.
Common Challenges and Modeling Pitfalls
The most common error in short-term forecasting is confusing accrual revenue with actual cash timing. A signed contract or issued invoice is not liquid cash until the funds clear your bank account. Treating accrual revenue as immediate cash creates cash shortfalls when customer payments drop into later weeks.
Another common pitfall is relying on accounting software cash balances instead of live bank balances. General ledger balances often include uncleared checks or pending adjustments, making them less reliable for cash decisions. Additional challenges include unassigned model ownership, monthly time buckets that mask weekly cash crunches, and complex multi-entity consolidation issues.
Transitioning from Spreadsheets to Treasury Automation
While basic spreadsheets work well for small businesses, manual models become difficult to maintain as companies grow. Tracking multiple entities, managing foreign exchange adjustments, or handling high transaction volumes in spreadsheets introduces operational complexity. Teams managing ten or more entities often find spreadsheet models unsustainable over time.
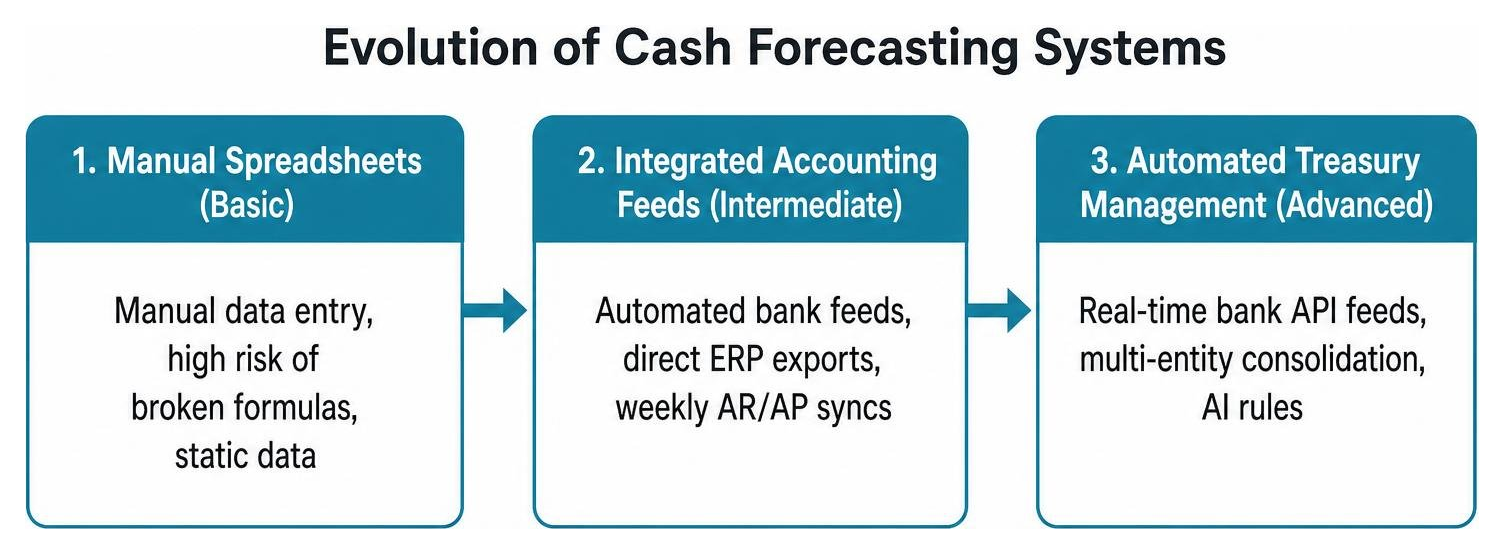
Modern financial tools automate bank feeds, pull directly from accounting systems, and offer dynamic reporting dashboards. Automated variance tracking reduces manual work and allows finance teams to focus on operational decisions. Upgrading your cash management infrastructure helps improve visibility and ensures long-term operational control.
FAQs About 13-Week Cash Flow Forecasting
How does a 13-week cash flow forecast differ from a standard monthly forecast?
A standard monthly forecast aggregates cash inflows and outflows into broad monthly totals, which can easily hide short-term cash crunches. For instance, a company might show positive monthly cash flow on paper but still run out of cash mid-month if payroll hits before customer receivables arrive. In contrast, a 13-week cash flow forecast breaks visibility down into 7-day increments, mapping exact receipt and payment timing. This granular approach exposes timing gaps weeks before they occur, giving management ample time to address potential shortfalls effectively.
What alert thresholds should businesses set in their cash flow model?
Businesses should establish a minimum cash safety threshold based on essential fixed operating expenses. A practical standard is setting the threshold to cover at least one full month of essential payroll, facility leases, insurance, and debt service. For example, if your monthly payroll is $100,000 and rent is $15,000, your minimum cash threshold should be set at $115,000. If projected weekly ending cash dips below this target, the model flags an early alert, indicating it is time to accelerate collections or limit discretionary spending.
How often should a 13-week cash flow forecast be updated?
Under standard operating conditions, cash flow models should be updated weekly on a fixed cadence. Updating the forecast weekly ensures management makes operational choices based on live bank data and current market realities. If a company is managing tight liquidity, navigating restructuring, or undergoing a major operational shift, updates should occur every two to three days or even daily. Maintaining a dynamic rolling window where completed weeks are replaced with actual bank results is key to preserving visibility.
Avoid a Crash Crunch with a Robust 13-Week Cash Flow Forecast
Mastering your short-term liquidity management requires turning complex financial data into a practical plan. Having a dynamic 13-week cash flow forecasting model gives business owners, CEOs, and finance leaders like you a clear operational runway. This forward visibility helps protect working capital, build lender trust, and support steady business expansion.
Managing rolling cash flow forecasts, working capital schedules, and lender reporting alongside daily operations can strain lean finance teams. Growing organizations often need high-level financial guidance without the expense of a full-time executive team. Partnering with external financial experts like us can help your business implement structured tools while controlling overhead costs.
At Optima Office, we deliver experienced fractional CFOs, controllers, bookkeepers, and outsourced accounting professionals who integrate directly into your operations. We assist businesses in Southern California and beyond by building custom financial reporting systems that protect liquidity and support long-term growth.
To better optimize your cash flow visibility, manage working capital, and build reliable financial operations, explore our services.
For any questions or to book a quick discovery call with our team, please or contact us today.