
Financial reporting dashboards are centralized, visual tools that pull live financial data from across your business, accounting systems, bank accounts, CRMs, and more, and display it in one place so leadership can make faster, better-informed decisions.
Additionally, modern financial reporting dashboards are a business intelligence tool that aggregates and visualizes key financial metrics, revenue, expenses, cash flow, budget vs. actual, and more, in real time, replacing static monthly spreadsheets with live, interactive data.
Here is a quick overview of what financial reporting dashboards are and why they matter for executive teams:
Who uses them?
- CEOs and business owners who need instant visibility into company health
- CFOs and controllers managing the monthly close and board reporting
- Department heads tracking budget performance and spend
- Investors and board members reviewing cash, margins, and growth
What problems do they solve?
- Books that close slowly or inconsistently
- Executives spending hours chasing financial updates from accounting staff
- Board members asking for reports the finance team cannot quickly produce
- Inability to see true profitability by customer, project, or product line
- Delayed invoicing and poor collections visibility
Key benefits of financial reporting dashboards for executive teams:
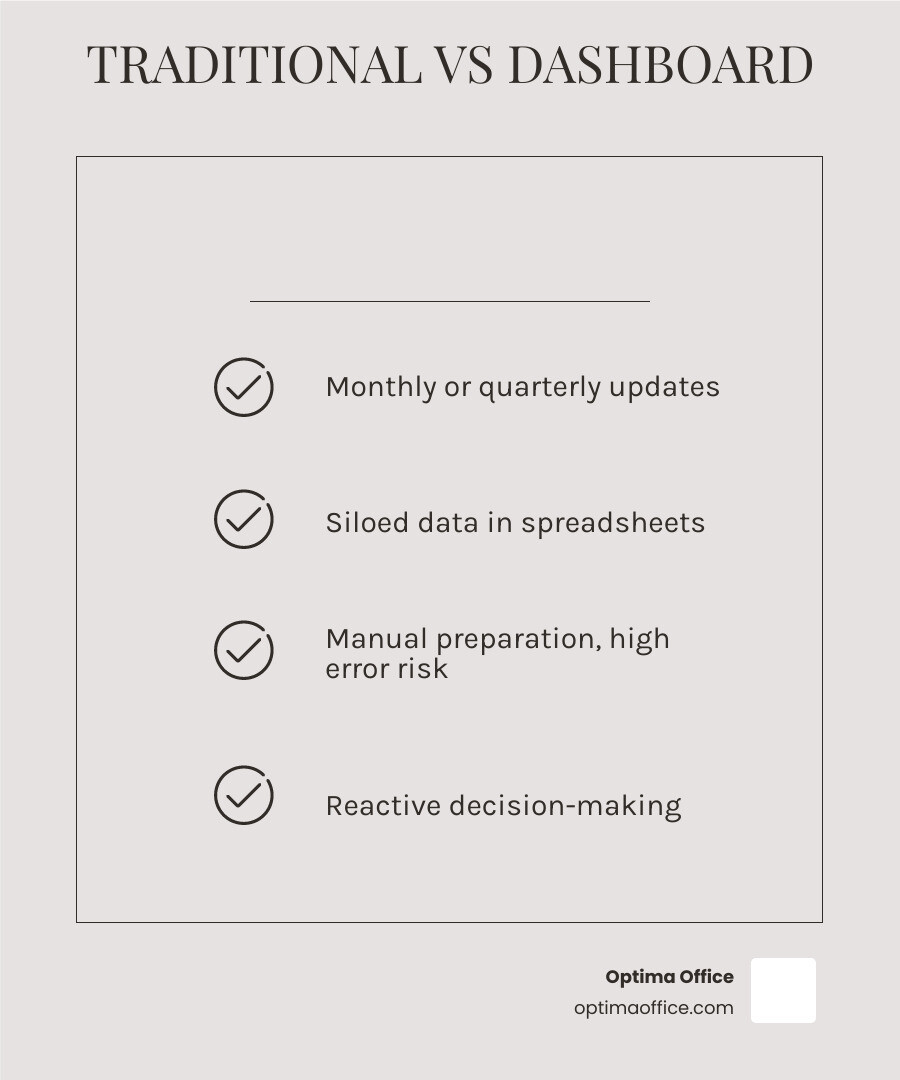
| Traditional Reporting | Financial Reporting Dashboard |
|---|---|
| Monthly or quarterly updates | Real-time or live updates |
| Siloed data in spreadsheets | Unified view across all systems |
| Manual preparation, high error risk | Automated data pulls, reduced errors |
| Limited to finance team | Self-service access for any stakeholder |
| Reactive decision-making | Proactive, in-the-moment decisions |
Finance teams using real-time dashboards report 30% faster reporting cycles and 25% better forecasting accuracy, and companies that implement interactive financial dashboards have seen ROI as high as 299% according to Forrester research on enterprise financial platforms.
For growing businesses in the $3M-$15M range, especially those without a full-time CFO or controller, the gap between what leadership needs to see and what accounting can actually deliver on time is a real and costly problem. A business leader shouldn’t have to wait until the 15th of the month to know whether cash flow was positive last month, or whether a key product line is profitable.
That delay, multiplied across every decision a leadership team makes, compounds into missed opportunities and avoidable risk.
In this case, modern financial reporting dashboards help close that gap. They transform the finance function from a backward-looking reporting department into a forward-looking decision engine, one that every executive can access without scheduling a meeting or waiting for a spreadsheet.
Understanding Financial Reporting Dashboards vs. Traditional Reports
In the past, financial reporting was a static, backward-looking exercise. We all remember the days of waiting for the “month-end pack” to arrive, often two weeks after the month had already closed. By the time you saw the numbers, they were already “stale,” making it difficult to pivot or address emerging issues. Today, financial reporting dashboards represent a fundamental shift from this reactive model to a proactive one.
Unlike traditional reports, which are often buried in dense spreadsheets or PDFs, a modern dashboard provides real-time visibility. It acts as a mirror reflecting the current state of your business. This is achieved through data centralization, where information from your ERP, bank accounts, and even HR systems is funneled into a single source of truth. Additionally, they allow for more dynamic viewing where you can filter data by department, region, or product line with a single click.
For many businesses in the U.S., the transition to these tools is often led by a fractional CFO. These financial experts understand that a dashboard isn’t just about pretty charts; it’s about accessibility. When data is centralized and live, you no longer have to request a report to know your cash position. You simply just log in and see it. This democratization of data ensures that every stakeholder is operating from the same set of facts.
The Evolution of Financial Reporting Dashboards
The evolution of these tools has moved us far beyond simple bar charts. Today’s financial reporting dashboards are highly interactive. They allow for “drill-down” capabilities, meaning if you see an unexpected spike in expenses, you can click on that metric to see the individual transactions driving it. You don’t have to leave the dashboard to find the “why” behind the “what.”
Automation has also removed the “grunt work” of reporting. In 2026, sophisticated platforms can automatically pull data, reconcile intercompany transactions, and even generate narrative commentary using AI. This allows your finance team to spend less time on data entry and more time on high-level analysis. Instead of just presenting results, these evolved tools empower decisions by providing context and foresight.
Essential KPIs and Metrics for High-Impact Dashboards
A dashboard is only as good as the metrics it tracks. While every business is unique, there are several “North Star” KPIs that should be present on almost any executive-level financial reporting dashboard. These include cash runway (how many months of operation you have left based on current spend) and burn rate. For many of our clients, tracking these is the difference between a controlled expansion and an unexpected cash crunch.
Other critical metrics include:
- EBITDA: A standard measure of operational profitability.
- AR/AP Aging: Categorizing account receivables and payables into buckets (0–30, 31–60, 61–90+ days) to manage liquidity.
- MRR (Monthly Recurring Revenue): Essential for subscription models, broken down by new, churned, and expanded revenue.
- Gross and Net Margins: To ensure that as you scale, you aren’t just growing top-line revenue at the expense of profit.
In 2026, GAAP Financial Reporting remains the bedrock of these metrics. Dashboards must be configured to handle 2026 Accounting Regulatory Changes, ensuring that the data being visualized is compliant with the latest standards for revenue recognition and lease accounting. This alignment ensures that your internal dashboard and your year-end audited statements tell the same story.
Customizing Financial Reporting Dashboards for Your Industry
One size does not fit all in finance. A SaaS company in San Diego will prioritize different metrics than a healthcare provider or a manufacturing firm. For instance, a SaaS reporting dashboard will focus heavily on customer acquisition cost (CAC) and lifetime value (LTV). In contrast, a healthcare organization might use their dashboard to track physician cost profiles or patient-level resource analysis.
Manufacturing businesses often require deep dives into inventory valuation and “Days Supply” to identify overstocked or understocked items. Professional service firms might focus on billable utilization and project-based profitability. By customizing your financial reporting dashboards to your specific industry, you ensure that the leadership team is looking at the levers that actually drive growth in your specific market.
Strategic Benefits for CFOs and Executive Teams
The strategic value of a well-implemented dashboard cannot be overstated. When we look at the data, the results are clear: finance teams using real-time insights report a 30% reduction in reporting cycles. This isn’t just about saving time; it’s about increasing forecasting accuracy. When you have live data, your ability to predict where the business will be in six months improves by roughly 25%.

For a CEO, the biggest benefit is often the “Executive in Your Inbox” feel, having the answers before you even have to ask the question. This level of oversight leads to a massive ROI, sometimes reaching 299% for enterprise-level implementations. It allows the leadership team to move away from debating whose spreadsheet is correct and toward discussing how to improve the business’s performance.
How Financial Reporting Dashboards Drive Better Decisions
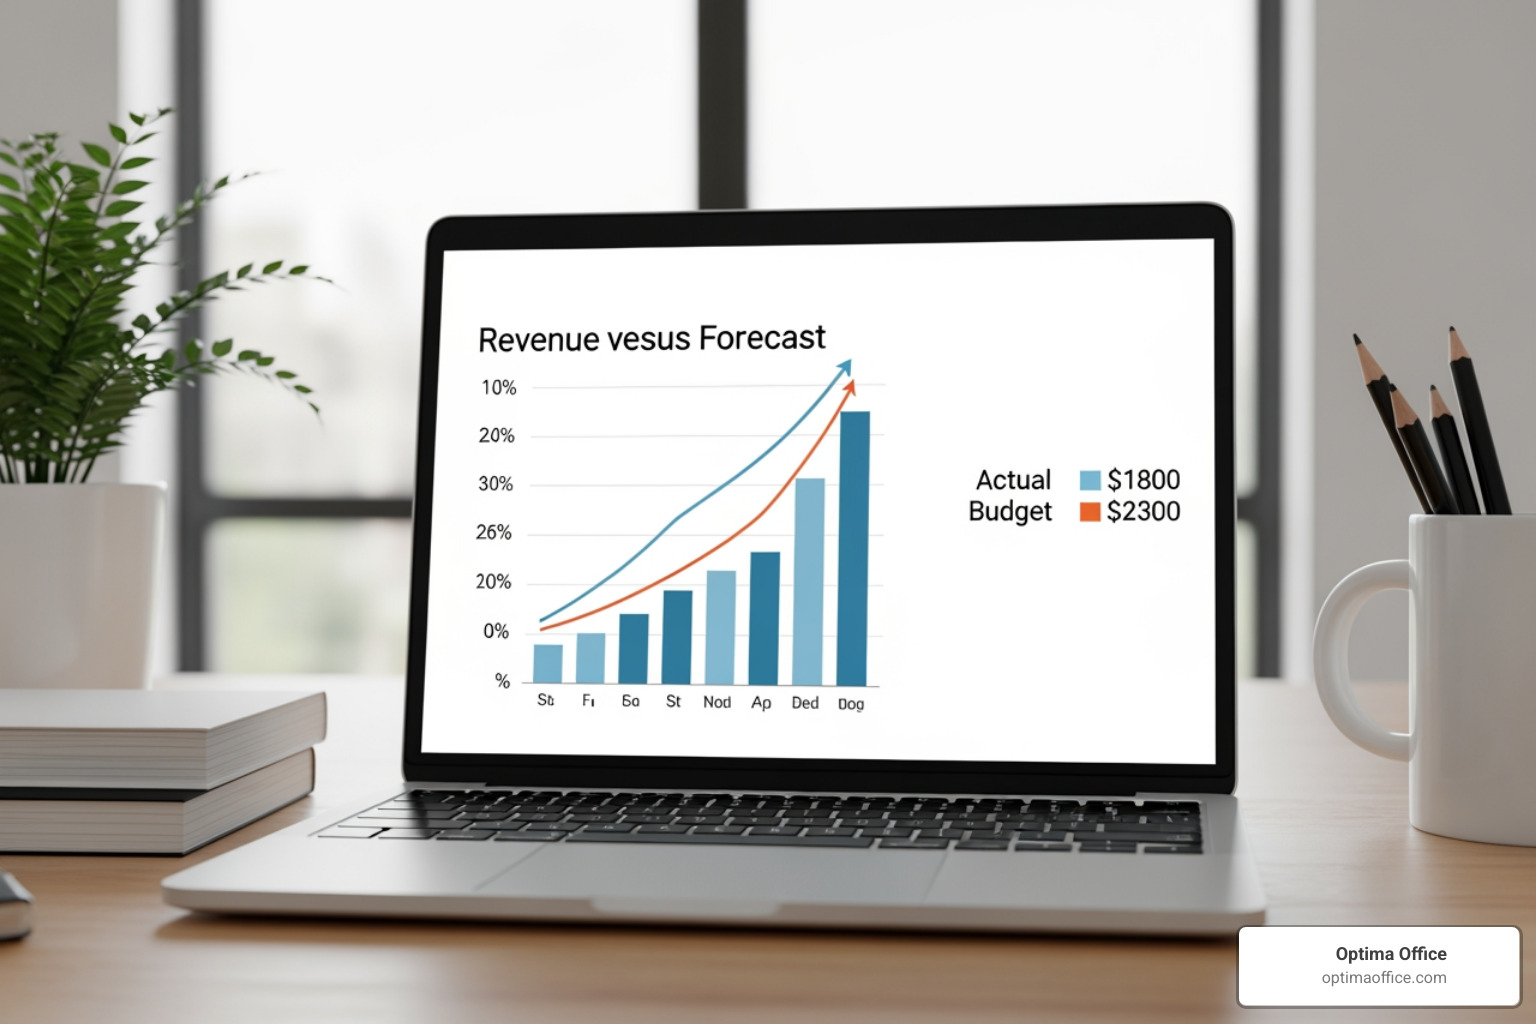
Dashboards drive better decisions through variance analysis. By comparing actual performance against your budget or forecast in real time, you can spot “red flags” early. For example, if your marketing spend is 20% over budget by the second week of the month, you can investigate and adjust immediately rather than finding out during the following month’s review.
Self-service access is another game-changer. When managers have access to their own department’s dashboard, they become more accountable for their budgets. Plus, they can easily see the impact of their spending decisions instantly. This transparency reduces the “bottleneck” at the finance department, as non-finance executives no longer need to wait for a controller to run a report to see if they have the budget for a new hire or a major purchase.
Building and Implementing Your Dashboard Ecosystem
Building a financial reporting dashboard in 2026 no longer requires a massive IT budget or months of custom coding. The rise of no-code platforms and AI-powered tools has made this technology accessible to small and mid-sized businesses. Many platforms now allow you to connect your data sources, like QuickBooks, Xero, or NetSuite, and generate a professional dashboard in under 60 seconds.
The typical implementation process involves:
- Defining the Structure: Identifying which KPIs matter most to your stakeholders.
- Data Integration: Connecting your ERP, CRM, and bank feeds via API or secure exports.
- Semantic Layering: Ensuring that account roll-ups and business logic are consistent across all views.
- Setting Permissions: Controlling who can see sensitive data, such as payroll or specific vendor costs.
Security is paramount. In 2026, any dashboard ecosystem must include robust data encryption and role-based access controls. This ensures that while data is “democratized,” it is also protected.
Choosing the Right Tools for Financial Reporting Dashboards
When choosing a tool, consider your team’s technical comfort level. Power BI is a powerhouse for those who need deep, multi-dimensional analysis and have the internal expertise to manage it. However, many founders and CEOs prefer “plug-and-play” specialized financial software that comes with pre-built templates for cash flow and burn rate.
We often recommend tools that feature a “semantic layer.” This is a fancy way of saying that if you change a calculation (like how you define “Gross Margin”) in one place, it updates across every chart in your dashboard. Furthermore, it helps prevent the “conflicting KPI” problem where two different reports show two different numbers for the same metric. AI automation is also a “must-have” feature now, as it can help write the narrative commentary for board decks, saving your CFO hours of manual work.
Best Practices for Dashboard Design and Launch
To ensure your financial reporting dashboards are actually used, follow a few design best practices. Firstly, keep it simple. A dashboard cluttered with 50 different charts is just as confusing as a 50-tab spreadsheet. Focus on the “Top 5” metrics on the main screen, with the ability to drill down for more detail.
Secondly, use visual cues. A “traffic light” system (red for underperforming, green for on-track) allows an executive to scan the dashboard in ten seconds and know exactly where their attention is needed. Thirdly, ensure the data is live. A dashboard that only updates once a week is barely better than a static report. Aim for at least daily refreshes, if not real-time.
Finally, before a full launch, run a “testing” phase. Compare the dashboard numbers against your traditional reports for one or two months to ensure the data mapping is 100% accurate. Once you trust the data, you can officially “retire” the manual spreadsheets and move your team into a more efficient, data-driven future.
FAQs About Financial Reporting Dashboards
What is the difference between a CFO and a Controller dashboard?
While they both pull from the same data, their focus is different. A Controller dashboard is operational. It tracks the status of the monthly close, bank reconciliations, and the integrity of the general ledger. It’s about ensuring the books are “right.” A CFO dashboard is strategic and forward-looking. It focuses on cash runway, investor-facing KPIs, and long-term trends to help the board make decisions about the future of the company.
How often should financial reporting dashboards be updated?
In 2026, the standard is real-time or live updates. As soon as a transaction hits your bank or ERP, it should ideally be reflected in your dashboard. However, for strategic planning, formal forecasts should be reviewed and adjusted at least quarterly. This ensures that your “Budget vs. Actual” comparisons remain realistic as market conditions change throughout the year.
Can small businesses afford advanced financial dashboards?
Absolutely. One of the biggest shifts in the last few years is that enterprise-grade financial oversight is no longer reserved for the Fortune 500. Through no-code platforms and fractional CFO services, small businesses can implement professional financial reporting dashboards for a fraction of the cost of a full-time hire. By doing this, smaller businesses can better compete with larger rivals by making smarter, faster, data-backed decisions.
Empowering Your Business with Real-Time Financial Intelligence
Transitioning to real-time financial oversight is the most significant upgrade a 2026 business can make to ensure long-term stability and growth. Optima Office provides the integrated finance and HR expertise needed to deploy these systems rapidly, often within 3-5 days, through our proprietary five-point system. Learn more about how Optima Insights can help you leverage professional dashboard implementation, so your leadership team can stop debating the numbers and start driving the enterprise forward.
Whether you’re a startup tracking your first year of revenue or an established business looking to modernize your reporting, the move to interactive dashboards is essential. It replaces the “guessing game” with clarity, and the “monthly wait” with instant insight.
If you have any questions about how Optima’s modern financial reporting dashboards can be customized for your executive leadership teams, please contact us today.